edisgo.network.results
Module Contents
Classes
Power flow analysis results management |
- class edisgo.network.results.Results(edisgo_object)[source]
Power flow analysis results management
Includes raw power flow analysis results, history of measures to increase the network’s hosting capacity and information about changes of equipment.
- property measures
List with measures conducted to increase network’s hosting capacity.
- Parameters
measure (str) – Measure to increase network’s hosting capacity. Possible options so far are ‘grid_expansion’, ‘storage_integration’, ‘curtailment’.
- Returns
A stack that details the history of measures to increase network’s hosting capacity. The last item refers to the latest measure. The key original refers to the state of the network topology as it was initially imported.
- Return type
- property pfa_p
Active power over components in MW from last power flow analysis.
The given active power for each line / transformer is the active power at the line ending / transformer side with the higher apparent power determined from active powers
 and
and
 and reactive powers
  and at the
line endings / transformer sides:
and at the
line endings / transformer sides: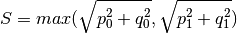
- Parameters
df (pandas.DataFrame) –
Results for active power over lines and transformers in MW from last power flow analysis. Index of the dataframe is a pandas.DatetimeIndex indicating the time period the power flow analysis was conducted for; columns of the dataframe are the representatives of the lines and stations included in the power flow analysis.
Provide this if you want to set values. For retrieval of data do not pass an argument.
- Returns
Results for active power over lines and transformers in MW from last power flow analysis. For more information on the dataframe see input parameter df.
- Return type
- property pfa_q
Active power over components in Mvar from last power flow analysis.
The given reactive power over each line / transformer is the reactive power at the line ending / transformer side with the higher apparent power determined from active powers
and
and reactive powers and  at the
line endings / transformer sides:
at the
line endings / transformer sides:- Parameters
df (pandas.DataFrame) –
Results for reactive power over lines and transformers in Mvar from last power flow analysis. Index of the dataframe is a pandas.DatetimeIndex indicating the time period the power flow analysis was conducted for; columns of the dataframe are the representatives of the lines and stations included in the power flow analysis.
Provide this if you want to set values. For retrieval of data do not pass an argument.
- Returns
Results for reactive power over lines and transformers in Mvar from last power flow analysis. For more information on the dataframe see input parameter df.
- Return type
- property v_res
Voltages at buses in p.u. from last power flow analysis.
- Parameters
df (pandas.DataFrame) –
Dataframe with voltages at buses in p.u. from last power flow analysis. Index of the dataframe is a pandas.DatetimeIndex indicating the time steps the power flow analysis was conducted for; columns of the dataframe are the bus names of all buses in the analyzed grids.
Provide this if you want to set values. For retrieval of data do not pass an argument.
- Returns
Dataframe with voltages at buses in p.u. from last power flow analysis. For more information on the dataframe see input parameter df.
- Return type
- property i_res
Current over components in kA from last power flow analysis.
- Parameters
df (pandas.DataFrame) –
Results for currents over lines and transformers in kA from last power flow analysis. Index of the dataframe is a pandas.DatetimeIndex indicating the time steps the power flow analysis was conducted for; columns of the dataframe are the representatives of the lines and stations included in the power flow analysis.
Provide this if you want to set values. For retrieval of data do not pass an argument.
- Returns
Results for current over lines and transformers in kA from last power flow analysis. For more information on the dataframe see input parameter df.
- Return type
- property s_res
Apparent power over components in MVA from last power flow analysis.
The given apparent power over each line / transformer is the apparent power at the line ending / transformer side with the higher apparent power determined from active powers
and
and reactive powers and at the
line endings / transformer sides:- Returns
Apparent power in MVA over lines and transformers. Index of the dataframe is a pandas.DatetimeIndex indicating the time steps the power flow analysis was conducted for; columns of the dataframe are the representatives of the lines and stations included in the power flow analysis.
- Return type
- property equipment_changes
Tracks changes to the grid topology.
When the grid is reinforced using
reinforceor new generators added usingimport_generators, new lines and/or transformers are added, lines split, etc. This is tracked in this attribute.- Parameters
df (pandas.DataFrame) –
Dataframe holding information on added, changed and removed lines and transformers. Index of the dataframe is in case of lines the name of the line, and in case of transformers the name of the grid the station is in (in case of MV/LV transformers the name of the LV grid and in case of HV/MV transformers the name of the MV grid). Columns are the following:
- equipmentstr
Type of new line or transformer as in
equipment_data.- changestr
Specifies if something was added, changed or removed.
- iteration_stepint
Grid reinforcement iteration step the change was conducted in. For changes conducted during grid integration of new generators the iteration step is set to 0.
- quantityint
Number of components added or removed. Only relevant for calculation of network expansion costs to keep track of how many new standard lines were added.
Provide this if you want to set values. For retrieval of data do not pass an argument.
- Returns
Dataframe holding information on added, changed and removed lines and transformers. For more information on the dataframe see input parameter df.
- Return type
- property grid_expansion_costs
Costs per expanded component in kEUR.
- Parameters
df (pandas.DataFrame) –
Costs per expanded line and transformer in kEUR. Index of the dataframe is the name of the expanded component as string. Columns are the following:
- typestr
Type of new line or transformer as in
equipment_data.- total_costsfloat
Costs of equipment in kEUR. For lines the line length and number of parallel lines is already included in the total costs.
- quantityint
For transformers quantity is always one, for lines it specifies the number of parallel lines.
- lengthfloat
Length of line or in case of parallel lines all lines in km.
- voltage_levelstr
Specifies voltage level the equipment is in (‘lv’, ‘mv’ or ‘mv/lv’).
Provide this if you want to set grid expansion costs. For retrieval of costs do not pass an argument.
- Returns
Costs per expanded line and transformer in kEUR. For more information on the dataframe see input parameter df.
- Return type
Notes
Network expansion measures are tracked in
equipment_changes. Resulting costs are calculated usinggrid_expansion_costs(). Total network expansion costs can be obtained through grid_expansion_costs.total_costs.sum().
- property grid_losses
Active and reactive network losses in MW and Mvar, respectively.
- Parameters
df (pandas.DataFrame) –
Results for active and reactive network losses in columns ‘p’ and ‘q’ and in MW and Mvar, respectively. Index is a pandas.DatetimeIndex.
Provide this if you want to set values. For retrieval of data do not pass an argument.
- Returns
Results for active and reactive network losses MW and Mvar, respectively. For more information on the dataframe see input parameter df.
- Return type
Notes
Grid losses are calculated as follows:


As the slack is placed at the station’s secondary side (if MV is included, it’s positioned at the HV/MV station’s secondary side and if a single LV grid is analysed it’s positioned at the LV station’s secondary side) losses do not include losses over the respective station’s transformers.
- property pfa_slack
Active and reactive power from slack in MW and Mvar, respectively.
In case the MV level is included in the power flow analysis, the slack is placed at the secondary side of the HV/MV station and gives the energy transferred to and taken from the HV network. In case a single LV network is analysed, the slack is positioned at the respective station’s secondary, in which case this gives the energy transferred to and taken from the overlying MV network.
- Parameters
df (pandas.DataFrame) –
Results for active and reactive power from the slack in MW and Mvar, respectively. Dataframe has the columns ‘p’, holding the active power results, and ‘q’, holding the reactive power results. Index is a pandas.DatetimeIndex.
Provide this if you want to set values. For retrieval of data do not pass an argument.
- Returns
Results for active and reactive power from the slack in MW and Mvar, respectively. For more information on the dataframe see input parameter df.
- Return type
- property pfa_v_mag_pu_seed
Voltages in p.u. from previous power flow analyses to be used as seed.
See
set_seed()for more information.- Parameters
df (pandas.DataFrame) –
Voltages at buses in p.u. from previous power flow analyses including the MV level. Index of the dataframe is a pandas.DatetimeIndex indicating the time steps previous power flow analyses were conducted for; columns of the dataframe are the representatives of the buses included in the power flow analyses.
Provide this if you want to set values. For retrieval of data do not pass an argument.
- Returns
Voltages at buses in p.u. from previous power flow analyses to be opionally used as seed in following power flow analyses. For more information on the dataframe see input parameter df.
- Return type
- property pfa_v_ang_seed
Voltages in p.u. from previous power flow analyses to be used as seed.
See
set_seed()for more information.- Parameters
df (pandas.DataFrame) –
Voltage angles at buses in radians from previous power flow analyses including the MV level. Index of the dataframe is a pandas.DatetimeIndex indicating the time steps previous power flow analyses were conducted for; columns of the dataframe are the representatives of the buses included in the power flow analyses.
Provide this if you want to set values. For retrieval of data do not pass an argument.
- Returns
Voltage angles at buses in radians from previous power flow analyses to be opionally used as seed in following power flow analyses. For more information on the dataframe see input parameter df.
- Return type
- property unresolved_issues
Lines and buses with remaining grid issues after network reinforcement.
In case overloading or voltage issues could not be solved after maximum number of iterations, network reinforcement is not aborted but network expansion costs are still calculated and unresolved issues listed here.
- Parameters
df (pandas.DataFrame) –
Dataframe containing remaining grid issues. Names of remaining critical lines, stations and buses are in the index of the dataframe. Columns depend on the equipment type. See
mv_line_load()for format of remaining overloading issues of lines,hv_mv_station_load()for format of remaining overloading issues of transformers, andmv_voltage_deviation()for format of remaining voltage issues.Provide this if you want to set unresolved_issues. For retrieval of data do not pass an argument.
- Returns
Dataframe with remaining grid issues. For more information on the dataframe see input parameter df.
- Return type
- reduce_memory(attr_to_reduce=None, to_type='float32')[source]
Reduces size of dataframes containing time series to save memory.
See
reduce_memoryfor more information.- Parameters
attr_to_reduce (list(str), optional) – List of attributes to reduce size for. Attributes need to be dataframes containing only time series. Possible options are: ‘pfa_p’, ‘pfa_q’, ‘v_res’, ‘i_res’, and ‘grid_losses’. Per default, all these attributes are reduced.
to_type (str, optional) – Data type to convert time series data to. This is a tradeoff between precision and memory. Default: “float32”.
Notes
Reducing the data type of the seeds for the power flow analysis,
pfa_v_mag_pu_seedandpfa_v_ang_seed, can lead to non-convergence of the power flow analysis, wherefore memory reduction is not provided for those attributes.
- equality_check(results_obj)[source]
Checks the equality of two results objects.
- Parameters
results_obj (:class:~.network.results.Results) – Contains the results of analyze function with default settings.
- Returns
True if equality check is successful, False otherwise.
- Return type
- to_csv(directory, parameters=None, reduce_memory=False, save_seed=False, **kwargs)[source]
Saves results to csv.
Saves power flow results and grid expansion results to separate directories. Which results are saved depends on what is specified in parameters. Per default, all attributes are saved.
Power flow results are saved to directory ‘powerflow_results’ and comprise the following, if not otherwise specified:
‘v_res’ : Attribute
v_resis saved to voltages_pu.csv.‘i_res’ : Attribute
i_resis saved to currents.csv.‘pfa_p’ : Attribute
pfa_pis saved to active_powers.csv.‘pfa_q’ : Attribute
pfa_qis saved to reactive_powers.csv.‘s_res’ : Attribute
s_resis saved to apparent_powers.csv.‘grid_losses’ : Attribute
grid_lossesis saved to grid_losses.csv.‘pfa_slack’ : Attribute
pfa_slackis saved to pfa_slack.csv.‘pfa_v_mag_pu_seed’ : Attribute
pfa_v_mag_pu_seedis saved to pfa_v_mag_pu_seed.csv, if save_seed is set to True.‘pfa_v_ang_seed’ : Attribute
pfa_v_ang_seedis saved to pfa_v_ang_seed.csv, if save_seed is set to True.
Grid expansion results are saved to directory ‘grid_expansion_results’ and comprise the following, if not otherwise specified:
grid_expansion_costs : Attribute
grid_expansion_costsis saved to grid_expansion_costs.csv.equipment_changes : Attribute
equipment_changesis saved to equipment_changes.csv.unresolved_issues : Attribute
unresolved_issuesis saved to unresolved_issues.csv.
- Parameters
directory (str) – Main directory to save the results in.
parameters (None or dict, optional) –
Specifies which results to save. By default this is set to None, in which case all results are saved. To only save certain results provide a dictionary. Possible keys are ‘powerflow_results’ and ‘grid_expansion_results’. Corresponding values must be lists with attributes to save or None to save all attributes. For example, with the first input only the power flow results i_res and v_res are saved, and with the second input all power flow results are saved.
{'powerflow_results': ['i_res', 'v_res']}
{'powerflow_results': None}
See function docstring for possible power flow and grid expansion results to save and under which file name they are saved.
reduce_memory (bool, optional) – If True, size of dataframes containing time series to save memory is reduced using
reduce_memory. Optional parameters ofreduce_memorycan be passed as kwargs to this function. Default: False.save_seed (bool, optional) – If True,
pfa_v_mag_pu_seedandpfa_v_ang_seedare as well saved as csv. As these are only relevant if calculations are not final, the default is False, in which case they are not saved.kwargs – Kwargs may contain optional arguments of
reduce_memory.
- from_csv(data_path, parameters=None, dtype=None, from_zip_archive=False)[source]
Restores results from csv files.
See
to_csv()for more information on which results can be saved and under which filename and directory they are stored.- Parameters
data_path (str) – Main data path results are saved in. Must be directory or zip archive.
parameters (None or dict, optional) – Specifies which results to restore. By default this is set to None, in which case all available results are restored. To only restore certain results provide a dictionary. Possible keys are ‘powerflow_results’ and ‘grid_expansion_results’. Corresponding values must be lists with attributes to restore or None to restore all available attributes. See function docstring parameters parameter in
to_csv()for more information.dtype (str, optional) – Numerical data type for data to be loaded from csv, e.g. “float32”. Per default this is None in which case data type is inferred.
from_zip_archive (bool, optional) – Set True if data is archived in a zip archive. Default: False.