edisgo.tools package
Submodules
edisgo.tools.config module
This file is part of eDisGo, a python package for distribution grid analysis and optimization.
It is developed in the project open_eGo: https://openegoproject.wordpress.com
eDisGo lives on github: https://github.com/openego/edisgo/ The documentation is available on RTD: http://edisgo.readthedocs.io
Based on code by oemof developing group
This module provides a highlevel layer for reading and writing config files.
-
edisgo.tools.config.load_config(filename, config_dir=None, copy_default_config=True)[source]¶ Loads the specified config file.
Parameters: - filename (
str) – Config file name, e.g. ‘config_grid.cfg’. - config_dir (
str, optional) – Path to config file. If None uses default edisgo config directory specified in config file ‘config_system.cfg’ in section ‘user_dirs’ by subsections ‘root_dir’ and ‘config_dir’. Default: None. - copy_default_config (Boolean) – If True copies a default config file into config_dir if the specified config file does not exist. Default: True.
- filename (
-
edisgo.tools.config.get(section, key)[source]¶ Returns the value of a given key of a given section of the main config file.
Parameters: Returns: The value which will be casted to float, int or boolean. If no cast is successful, the raw string is returned.
Return type:
-
edisgo.tools.config.get_default_config_path()[source]¶ Returns the basic edisgo config path. If it does not yet exist it creates it and copies all default config files into it.
Returns: Path to default edisgo config directory specified in config file ‘config_system.cfg’ in section ‘user_dirs’ by subsections ‘root_dir’ and ‘config_dir’. Return type: str
edisgo.tools.edisgo_run module
edisgo.tools.geo module
-
edisgo.tools.geo.proj2equidistant(network)[source]¶ Defines conformal (e.g. WGS84) to ETRS (equidistant) projection Source CRS is loaded from Network’s config.
Parameters: network ( Network) – The eDisGo container objectReturns: Return type: functools.partial()
-
edisgo.tools.geo.proj2conformal(network)[source]¶ Defines ETRS (equidistant) to conformal (e.g. WGS84) projection. Target CRS is loaded from Network’s config.
Parameters: network ( Network) – The eDisGo container objectReturns: Return type: functools.partial()
-
edisgo.tools.geo.calc_geo_lines_in_buffer(network, node, grid, radius, radius_inc)[source]¶ Determines lines in nodes’ associated graph that are at least partly within buffer of radius from node. If there are no lines, the buffer is successively extended by radius_inc until lines are found.
Parameters: - network (
Network) – The eDisGo container object - node (
Component) – Origin node the buffer is created around (e.g.Generator). Node must be a member of grid’s graph (grid.graph) - grid (
Grid) – Grid whose lines are searched - radius (
float) – Buffer radius in m - radius_inc (
float) – Buffer radius increment in m
Returns: Sorted (by repr()) list of lines
Return type: Notes
Adapted from Ding0.
- network (
edisgo.tools.plots module
-
edisgo.tools.plots.histogram(data, **kwargs)[source]¶ Function to create histogram, e.g. for voltages or currents.
Parameters: - data (pandas.DataFrame) – Data to be plotted, e.g. voltage or current (v_res or i_res from
edisgo.grid.network.Results). Index of the dataframe must be a pandas.DatetimeIndex. - timeindex (pandas.Timestamp or list(pandas.Timestamp) or None, optional) – Specifies time steps histogram is plotted for. If timeindex is None all time steps provided in data are used. Default: None.
- directory (
stror None, optional) – Path to directory the plot is saved to. Is created if it does not exist. Default: None. - filename (
stror None, optional) – Filename the plot is saved as. File format is specified by ending. If filename is None, the plot is shown. Default: None. - color (
stror None, optional) – Color used in plot. If None it defaults to blue. Default: None. - alpha (
float, optional) – Transparency of the plot. Must be a number between 0 and 1, where 0 is see through and 1 is opaque. Default: 1. - title (
stror None, optional) – Plot title. Default: None. - x_label (
str, optional) – Label for x-axis. Default: “”. - y_label (
str, optional) – Label for y-axis. Default: “”. - normed (
bool, optional) – Defines if histogram is normed. Default: False. - x_limits (
tupleor None, optional) – Tuple with x-axis limits. First entry is the minimum and second entry the maximum value. Default: None. - y_limits (
tupleor None, optional) – Tuple with y-axis limits. First entry is the minimum and second entry the maximum value. Default: None. - fig_size (
strortuple, optional) –- Size of the figure in inches or a string with the following options:
- ’a4portrait’
- ’a4landscape’
- ’a5portrait’
- ’a5landscape’
Default: ‘a5landscape’.
- binwidth (
float) – Width of bins. Default: None.
- data (pandas.DataFrame) – Data to be plotted, e.g. voltage or current (v_res or i_res from
-
edisgo.tools.plots.get_grid_district_polygon(config, subst_id=None, projection=4326)[source]¶ Get MV grid district polygon from oedb for plotting.
-
edisgo.tools.plots.mv_grid_topology(pypsa_network, configs, timestep=None, line_color=None, node_color=None, line_load=None, grid_expansion_costs=None, filename=None, arrows=False, grid_district_geom=True, background_map=True, voltage=None, limits_cb_lines=None, limits_cb_nodes=None, xlim=None, ylim=None, lines_cmap='inferno_r', title='', scaling_factor_line_width=None)[source]¶ Plot line loading as color on lines.
Displays line loading relative to nominal capacity.
Parameters: - pypsa_network (pypsa.Network) –
- configs (
dict) – Dictionary with used configurations from config files. SeeConfigfor more information. - timestep (pandas.Timestamp) – Time step to plot analysis results for. If timestep is None maximum line load and if given, maximum voltage deviation, is used. In that case arrows cannot be drawn. Default: None.
- line_color (
stror None) –Defines whereby to choose line colors (and implicitly size). Possible options are:
- ’loading’ Line color is set according to loading of the line. Loading of MV lines must be provided by parameter line_load.
- ’expansion_costs’ Line color is set according to investment costs of the line. This option also effects node colors and sizes by plotting investment in stations and setting node_color to ‘storage_integration’ in order to plot storage size of integrated storages. Grid expansion costs must be provided by parameter grid_expansion_costs.
- None (default) Lines are plotted in black. Is also the fallback option in case of wrong input.
- node_color (
stror None) –Defines whereby to choose node colors (and implicitly size). Possible options are:
- ’technology’ Node color as well as size is set according to type of node (generator, MV station, etc.).
- ’voltage’ Node color is set according to voltage deviation from 1 p.u.. Voltages of nodes in MV grid must be provided by parameter voltage.
- ’storage_integration’ Only storages are plotted. Size of node corresponds to size of storage.
- None (default) Nodes are not plotted. Is also the fallback option in case of wrong input.
- line_load (pandas.DataFrame or None) – Dataframe with current results from power flow analysis in A. Index of the dataframe is a pandas.DatetimeIndex, columns are the line representatives. Only needs to be provided when parameter line_color is set to ‘loading’. Default: None.
- grid_expansion_costs (pandas.DataFrame or None) – Dataframe with grid expansion costs in kEUR. See grid_expansion_costs
in
Resultsfor more information. Only needs to be provided when parameter line_color is set to ‘expansion_costs’. Default: None. - filename (
str) – Filename to save plot under. If not provided, figure is shown directly. Default: None. - arrows (
Boolean) – If True draws arrows on lines in the direction of the power flow. Does only work when line_color option ‘loading’ is used and a time step is given. Default: False. - grid_district_geom (
Boolean) – If True grid district polygon is plotted in the background. This also requires the geopandas package to be installed. Default: True. - background_map (
Boolean) – If True map is drawn in the background. This also requires the contextily package to be installed. Default: True. - voltage (pandas.DataFrame) – Dataframe with voltage results from power flow analysis in p.u.. Index of the dataframe is a pandas.DatetimeIndex, columns are the bus representatives. Only needs to be provided when parameter node_color is set to ‘voltage’. Default: None.
- limits_cb_lines (
tuple) – Tuple with limits for colorbar of line color. First entry is the minimum and second entry the maximum value. Only needs to be provided when parameter line_color is not None. Default: None. - limits_cb_nodes (
tuple) – Tuple with limits for colorbar of nodes. First entry is the minimum and second entry the maximum value. Only needs to be provided when parameter node_color is not None. Default: None. - xlim (
tuple) – Limits of x-axis. Default: None. - ylim (
tuple) – Limits of y-axis. Default: None. - lines_cmap (
str) – Colormap to use for lines in case line_color is ‘loading’ or ‘expansion_costs’. Default: ‘inferno_r’. - title (
str) – Title of the plot. Default: ‘’. - scaling_factor_line_width (
floator None) – If provided line width is set according to the nominal apparent power of the lines. If line width is None a default line width of 2 is used for each line. Default: None.
edisgo.tools.pypsa_io module
This module provides tools to convert graph based representation of the grid
topology to PyPSA data model. Call to_pypsa() to retrieve the PyPSA grid
container.
-
edisgo.tools.pypsa_io.to_pypsa(network, mode, timesteps)[source]¶ Translate graph based grid representation to PyPSA Network
For details from a user perspective see API documentation of
analyze()of the API classEDisGo.Translating eDisGo’s grid topology to PyPSA representation is structured into translating the topology and adding time series for components of the grid. In both cases translation of MV grid only (mode=’mv’), LV grid only (mode=’lv’), MV and LV (mode=None) share some code. The code is organized as follows:
- Medium-voltage only (mode=’mv’): All medium-voltage grid components are
exported by
mv_to_pypsa()including the LV station. LV grid load and generation is considered usingadd_aggregated_lv_components(). Time series are collected by _pypsa_load_timeseries (as example for loads, generators and buses) specifying mode=’mv’). Timeseries for aggregated load/generation at substations are determined individually. - Low-voltage only (mode=’lv’): LV grid topology including the MV-LV transformer is exported. The slack is defind at primary side of the MV-LV transformer.
- Both level MV+LV (mode=None): The entire grid topology is translated to
PyPSA in order to perform a complete power flow analysis in both levels
together. First, both grid levels are translated seperately using
mv_to_pypsa()andlv_to_pypsa(). Those are merge bycombine_mv_and_lv(). Time series are obtained at once for both grid levels.
This PyPSA interface is aware of translation errors and performs so checks on integrity of data converted to PyPSA grid representation
- Sub-graphs/ Sub-networks: It is ensured the grid has no islanded parts
- Completeness of time series: It is ensured each component has a time series
- Buses available: Each component (load, generator, line, transformer) is connected to a bus. The PyPSA representation is check for completeness of buses.
- Duplicate labels in components DataFrames and components’ time series DataFrames
Parameters: - network (
Network) – eDisGo grid container - mode (str) –
Determines grid levels that are translated to PyPSA grid representation. Specify
- None to export MV and LV grid levels. None is the default.
- (‘mv’ to export MV grid level only. This includes cumulative load and generation from underlying LV grid aggregated at respective LV station. This option is implemented, though the rest of edisgo does not handle it yet.)
- (‘lv’ to export LV grid level only. This option is not yet
- implemented)
- timesteps (pandas.DatetimeIndex or pandas.Timestamp) – Timesteps specifies which time steps to export to pypsa representation and use in power flow analysis.
Returns: The PyPSA network container.
Return type: - Medium-voltage only (mode=’mv’): All medium-voltage grid components are
exported by
-
edisgo.tools.pypsa_io.mv_to_pypsa(network)[source]¶ Translate MV grid topology representation to PyPSA format
MV grid topology translated here includes
- MV station (no transformer, see
analyze()) - Loads, Generators, Lines, Storages, Branch Tees of MV grid level as well as LV stations. LV stations do not have load and generation of LV level.
Parameters: network (Network) – eDisGo grid container Returns: - dict of pandas.DataFrame – A DataFrame for each type of PyPSA components constituting the grid
topology. Keys included
- ’Generator’
- ’Load’
- ’Line’
- ’BranchTee’
- ’Transformer’
- ’StorageUnit’
- .. warning:: – PyPSA takes resistance R and reactance X in p.u. The conversion from
values in ohm to pu notation is performed by following equations
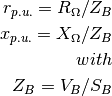
I’m quite sure, but its not 100 % clear if the base voltage V_B is chosen correctly. We take the primary side voltage of transformer as the transformers base voltage. See #54 for discussion.
- MV station (no transformer, see
-
edisgo.tools.pypsa_io.lv_to_pypsa(network)[source]¶ Convert LV grid topology to PyPSA representation
Includes grid topology of all LV grids of
lv_gridsParameters: network (Network) – eDisGo grid container Returns: A DataFrame for each type of PyPSA components constituting the grid topology. Keys included - ’Generator’
- ’Load’
- ’Line’
- ’BranchTee’
- ’StorageUnit’
Return type: dict of pandas.DataFrame
-
edisgo.tools.pypsa_io.combine_mv_and_lv(mv, lv)[source]¶ Combine MV and LV grid topology in PyPSA format
-
edisgo.tools.pypsa_io.add_aggregated_lv_components(network, components)[source]¶ Aggregates LV load and generation at LV stations
Use this function if you aim for MV calculation only. The according DataFrames of components are extended by load and generators representing these aggregated respecting the technology type.
Parameters: - network (Network) – The eDisGo grid topology model overall container
- components (dict of pandas.DataFrame) – PyPSA components in tabular format
Returns: The dictionary components passed to the function is returned altered.
Return type:
-
edisgo.tools.pypsa_io.process_pfa_results(network, pypsa, timesteps)[source]¶ Assing values from PyPSA to
resultsParameters: - network (Network) – The eDisGo grid topology model overall container
- pypsa (pypsa.Network) – The PyPSA Network container
- timesteps (pandas.DatetimeIndex or pandas.Timestamp) – Time steps for which latest power flow analysis was conducted for and for which to retrieve pypsa results.
Notes
P and Q (and respectively later S) are returned from the line ending/ transformer side with highest apparent power S, exemplary written as

See also
Results- Understand how results of power flow analysis are structured in eDisGo.
-
edisgo.tools.pypsa_io.update_pypsa_generator_import(network)[source]¶ Translate graph based grid representation to PyPSA Network
For details from a user perspective see API documentation of
analyze()of the API classEDisGo.Translating eDisGo’s grid topology to PyPSA representation is structured into translating the topology and adding time series for components of the grid. In both cases translation of MV grid only (mode=’mv’), LV grid only (mode=’lv’), MV and LV (mode=None) share some code. The code is organized as follows:
- Medium-voltage only (mode=’mv’): All medium-voltage grid components are
exported by
mv_to_pypsa()including the LV station. LV grid load and generation is considered usingadd_aggregated_lv_components(). Time series are collected by _pypsa_load_timeseries (as example for loads, generators and buses) specifying mode=’mv’). Timeseries for aggregated load/generation at substations are determined individually. - Low-voltage only (mode=’lv’): LV grid topology including the MV-LV transformer is exported. The slack is defind at primary side of the MV-LV transformer.
- Both level MV+LV (mode=None): The entire grid topology is translated to
PyPSA in order to perform a complete power flow analysis in both levels
together. First, both grid levels are translated seperately using
mv_to_pypsa()andlv_to_pypsa(). Those are merge bycombine_mv_and_lv(). Time series are obtained at once for both grid levels.
This PyPSA interface is aware of translation errors and performs so checks on integrity of data converted to PyPSA grid representation
- Sub-graphs/ Sub-networks: It is ensured the grid has no islanded parts
- Completeness of time series: It is ensured each component has a time series
- Buses available: Each component (load, generator, line, transformer) is connected to a bus. The PyPSA representation is check for completeness of buses.
- Duplicate labels in components DataFrames and components’ time series DataFrames
Parameters: - network (
Network) – eDisGo grid container - mode (str) –
Determines grid levels that are translated to PyPSA grid representation. Specify
- None to export MV and LV grid levels. None is the default.
- (‘mv’ to export MV grid level only. This includes cumulative load and generation from underlying LV grid aggregated at respective LV station. This option is implemented, though the rest of edisgo does not handle it yet.)
- (‘lv’ to export LV grid level only. This option is not yet
- implemented)
- timesteps (pandas.DatetimeIndex or pandas.Timestamp) – Timesteps specifies which time steps to export to pypsa representation and use in power flow analysis.
Returns: The PyPSA network container.
Return type: - Medium-voltage only (mode=’mv’): All medium-voltage grid components are
exported by
-
edisgo.tools.pypsa_io.update_pypsa_grid_reinforcement(network, equipment_changes)[source]¶ Update equipment data of lines and transformers after grid reinforcement.
During grid reinforcement (cf.
edisgo.flex_opt.reinforce_grid.reinforce_grid()) grid topology and equipment of lines and transformers are changed. In order to save time and not do a full translation of eDisGo’s grid topology to the PyPSA format, this function provides an updater for data that may change during grid reinforcement.The PyPSA grid topology
edisgo.grid.network.Network.pypsa()is update by changed equipment stored inedisgo.grid.network.Network.equipment_changes.Parameters:
-
edisgo.tools.pypsa_io.update_pypsa_storage(pypsa, storages, storages_lines)[source]¶ Adds storages and their lines to pypsa representation of the edisgo graph.
This function effects the following attributes of the pypsa network: components (‘StorageUnit’), storage_units, storage_units_t (p_set, q_set), buses, lines
Parameters: - pypsa (pypsa.Network) –
- storages (
list) – List with storages of typeStorageto add to pypsa network. - storages_lines (
list) – List with lines of typeLinethat connect storages to the grid.
-
edisgo.tools.pypsa_io.update_pypsa_timeseries(network, loads_to_update=None, generators_to_update=None, storages_to_update=None, timesteps=None)[source]¶ Updates load, generator, storage and bus time series in pypsa network.
See functions
update_pypsa_load_timeseries(),update_pypsa_generator_timeseries(),update_pypsa_storage_timeseries(), andupdate_pypsa_bus_timeseries()for more information.Parameters: - network (Network) – The eDisGo grid topology model overall container
- loads_to_update (
list, optional) – List with all loads (of typeLoad) that need to be updated. If None all loads are updated depending on mode. Seeto_pypsa()for more information. - generators_to_update (
list, optional) – List with all generators (of typeGenerator) that need to be updated. If None all generators are updated depending on mode. Seeto_pypsa()for more information. - storages_to_update (
list, optional) – List with all storages (of typeStorage) that need to be updated. If None all storages are updated depending on mode. Seeto_pypsa()for more information. - timesteps (pandas.DatetimeIndex or pandas.Timestamp) – Timesteps specifies which time steps of the load time series to export to pypsa representation and use in power flow analysis. If None all time steps currently existing in pypsa representation are updated. If not None current time steps are overwritten by given time steps. Default: None.
-
edisgo.tools.pypsa_io.update_pypsa_load_timeseries(network, loads_to_update=None, timesteps=None)[source]¶ Updates load time series in pypsa representation.
This function overwrites p_set and q_set of loads_t attribute of pypsa network. Be aware that if you call this function with timesteps and thus overwrite current time steps it may lead to inconsistencies in the pypsa network since only load time series are updated but none of the other time series or the snapshots attribute of the pypsa network. Use the function
update_pypsa_timeseries()to change the time steps you want to analyse in the power flow analysis. This function will also raise an error when a load that is currently not in the pypsa representation is added.Parameters: - network (Network) – The eDisGo grid topology model overall container
- loads_to_update (
list, optional) – List with all loads (of typeLoad) that need to be updated. If None all loads are updated depending on mode. Seeto_pypsa()for more information. - timesteps (pandas.DatetimeIndex or pandas.Timestamp) – Timesteps specifies which time steps of the load time series to export to pypsa representation. If None all time steps currently existing in pypsa representation are updated. If not None current time steps are overwritten by given time steps. Default: None.
-
edisgo.tools.pypsa_io.update_pypsa_generator_timeseries(network, generators_to_update=None, timesteps=None)[source]¶ Updates generator time series in pypsa representation.
This function overwrites p_set and q_set of generators_t attribute of pypsa network. Be aware that if you call this function with timesteps and thus overwrite current time steps it may lead to inconsistencies in the pypsa network since only generator time series are updated but none of the other time series or the snapshots attribute of the pypsa network. Use the function
update_pypsa_timeseries()to change the time steps you want to analyse in the power flow analysis. This function will also raise an error when a generator that is currently not in the pypsa representation is added.Parameters: - network (Network) – The eDisGo grid topology model overall container
- generators_to_update (
list, optional) – List with all generators (of typeGenerator) that need to be updated. If None all generators are updated depending on mode. Seeto_pypsa()for more information. - timesteps (pandas.DatetimeIndex or pandas.Timestamp) – Timesteps specifies which time steps of the generator time series to export to pypsa representation. If None all time steps currently existing in pypsa representation are updated. If not None current time steps are overwritten by given time steps. Default: None.
-
edisgo.tools.pypsa_io.update_pypsa_storage_timeseries(network, storages_to_update=None, timesteps=None)[source]¶ Updates storage time series in pypsa representation.
This function overwrites p_set and q_set of storage_unit_t attribute of pypsa network. Be aware that if you call this function with timesteps and thus overwrite current time steps it may lead to inconsistencies in the pypsa network since only storage time series are updated but none of the other time series or the snapshots attribute of the pypsa network. Use the function
update_pypsa_timeseries()to change the time steps you want to analyse in the power flow analysis. This function will also raise an error when a storage that is currently not in the pypsa representation is added.Parameters: - network (Network) – The eDisGo grid topology model overall container
- storages_to_update (
list, optional) – List with all storages (of typeStorage) that need to be updated. If None all storages are updated depending on mode. Seeto_pypsa()for more information. - timesteps (pandas.DatetimeIndex or pandas.Timestamp) – Timesteps specifies which time steps of the storage time series to export to pypsa representation. If None all time steps currently existing in pypsa representation are updated. If not None current time steps are overwritten by given time steps. Default: None.
-
edisgo.tools.pypsa_io.update_pypsa_bus_timeseries(network, timesteps=None)[source]¶ Updates buses voltage time series in pypsa representation.
This function overwrites v_mag_pu_set of buses_t attribute of pypsa network. Be aware that if you call this function with timesteps and thus overwrite current time steps it may lead to inconsistencies in the pypsa network since only bus time series are updated but none of the other time series or the snapshots attribute of the pypsa network. Use the function
update_pypsa_timeseries()to change the time steps you want to analyse in the power flow analysis.Parameters: - network (Network) – The eDisGo grid topology model overall container
- timesteps (pandas.DatetimeIndex or pandas.Timestamp) – Timesteps specifies which time steps of the time series to export to pypsa representation. If None all time steps currently existing in pypsa representation are updated. If not None current time steps are overwritten by given time steps. Default: None.
edisgo.tools.tools module
-
edisgo.tools.tools.select_worstcase_snapshots(network)[source]¶ Select two worst-case snapshots from time series
Two time steps in a time series represent worst-case snapshots. These are
- Load case: refers to the point in the time series where the
- (load - generation) achieves its maximum and is greater than 0.
- Feed-in case: refers to the point in the time series where the
- (load - generation) achieves its minimum and is smaller than 0.
These two points are identified based on the generation and load time series. In case load or feed-in case don’t exist None is returned.
Parameters: network ( Network) – Network for which worst-case snapshots are identified.Returns: Dictionary with keys ‘load_case’ and ‘feedin_case’. Values are corresponding worst-case snapshots of type pandas.Timestamp or None. Return type: dict
-
edisgo.tools.tools.get_residual_load_from_pypsa_network(pypsa_network)[source]¶ Calculates residual load in MW in MV grid and underlying LV grids.
Parameters: pypsa_network (pypsa.Network) – The PyPSA network container, containing load flow results.
Returns: Series with residual load in MW for each time step. Positiv values indicate a higher demand than generation and vice versa. Index of the series is a pandas.DatetimeIndex Return type: pandas.Series
-
edisgo.tools.tools.assign_load_feedin_case(network)[source]¶ For each time step evaluate whether it is a feed-in or a load case.
Feed-in and load case are identified based on the generation and load time series and defined as follows:
- Load case: positive (load - generation) at HV/MV substation
- Feed-in case: negative (load - generation) at HV/MV substation
Output of this function is written to timesteps_load_feedin_case attribute of the network.timeseries (see
TimeSeries).Parameters: network ( Network) – Network for which worst-case snapshots are identified.Returns: Dataframe with information on whether time step is handled as load case (‘load_case’) or feed-in case (‘feedin_case’) for each time step in timeindex attribute of network.timeseries. Index of the dataframe is network.timeseries.timeindex. Columns of the dataframe are ‘residual_load’ with (load - generation) in kW at HV/MV substation and ‘case’ with ‘load_case’ for positive residual load and ‘feedin_case’ for negative residual load. Return type: pandas.DataFrame
-
edisgo.tools.tools.calculate_relative_line_load(network, configs, line_load, line_voltages, lines=None, timesteps=None)[source]¶ Calculates relative line loading.
Line loading is calculated by dividing the current at the given time step by the allowed current.
Parameters: - network (pypsa.Network) – Pypsa network with lines to calculate line loading for.
- configs (
dict) – Dictionary with used configurations from config files. SeeConfigfor more information. - line_load (pandas.DataFrame) – Dataframe with current results from power flow analysis in A. Index of the dataframe is a pandas.DatetimeIndex, columns are the line representatives.
- line_voltages (pandas.Series) – Series with nominal voltages of lines in kV. Index of the dataframe are the line representatives.
- lines (list(str) or None, optional) – Line names/representatives of lines to calculate line loading for. If None line loading of all lines in line_load dataframe are used. Default: None.
- timesteps (pandas.Timestamp or list(pandas.Timestamp) or None, optional) – Specifies time steps to calculate line loading for. If timesteps is None all time steps in line_load dataframe are used. Default: None.
Returns: Dataframe with relative line loading (unitless). Index of the dataframe is a pandas.DatetimeIndex, columns are the line representatives.
Return type: